About Me
Hi, my name is Ryan Joseph. I am a Computer Science major at the University of Maryland College Park. I am interested in data science, AI/ML, software engineering, and computer vision along with their application to real world problems in fields such as sports and healthcare. I am especially passionate about sports analytics and love diving into new datasets to create models and visualizations for various sports.
At the University of Maryland, I am currently involved in the sports analytics club, where we discuss sports trends, and analytics and create projects to work with UMD Athletics. I am also a part of the First-Year Innovation & Research Experience (FIRE) program.
I have created many interactive web apps and machine learning models using Python and R. Some of my projects are shown below. My other work can be found in my Github. Feel free to reach out me to connect!
Experience
Languages/Frameworks
- Python
- Java
- R
- HTML/CSS
- JavaScript
- SQL
- React
- TypeScript
- Flask
- NextJS
Technical Projects
CBB Shot Analysis

Implemented Python web app that creates 3D college basketball shot charts for teams and individual players. Plots trends such as heat maps, assist distribution, and shot locations. Uses DeepSeek LLM to provide AI scouting reports for teams and player breakdowns for draft prospects.
CodeNHL Shot Analysis

Dashboard that visualizes NHL shot attempts using data from MoneyPuck. Uses LightGBM model to calculate goal probability for each shot attempt. Incorporates DeepSeek LLM to analyze and breakdown individual shot attempts
Code3D MLB Visualizer

Visualizes hits and pitches from MLB games with 3D hit chart along with a 3D pitch chart using MLB Statcast data. Includes machine learning models to predict home run and strike probability for individual hits and pitches.
CodeNFL Passing Analyzer

Dashboard that plots NFL passing data for quarterbacks in 3D. Pass trajectory and result displayed on a 3D field showing air yards on every pass. Built with Streamlit and Plotly.
Code3D Soccer Visualizer

Plots and visualizes soccer match data such as shots, passes, pressures, etc. on a 3D field. Uses statsbombpy Python API.
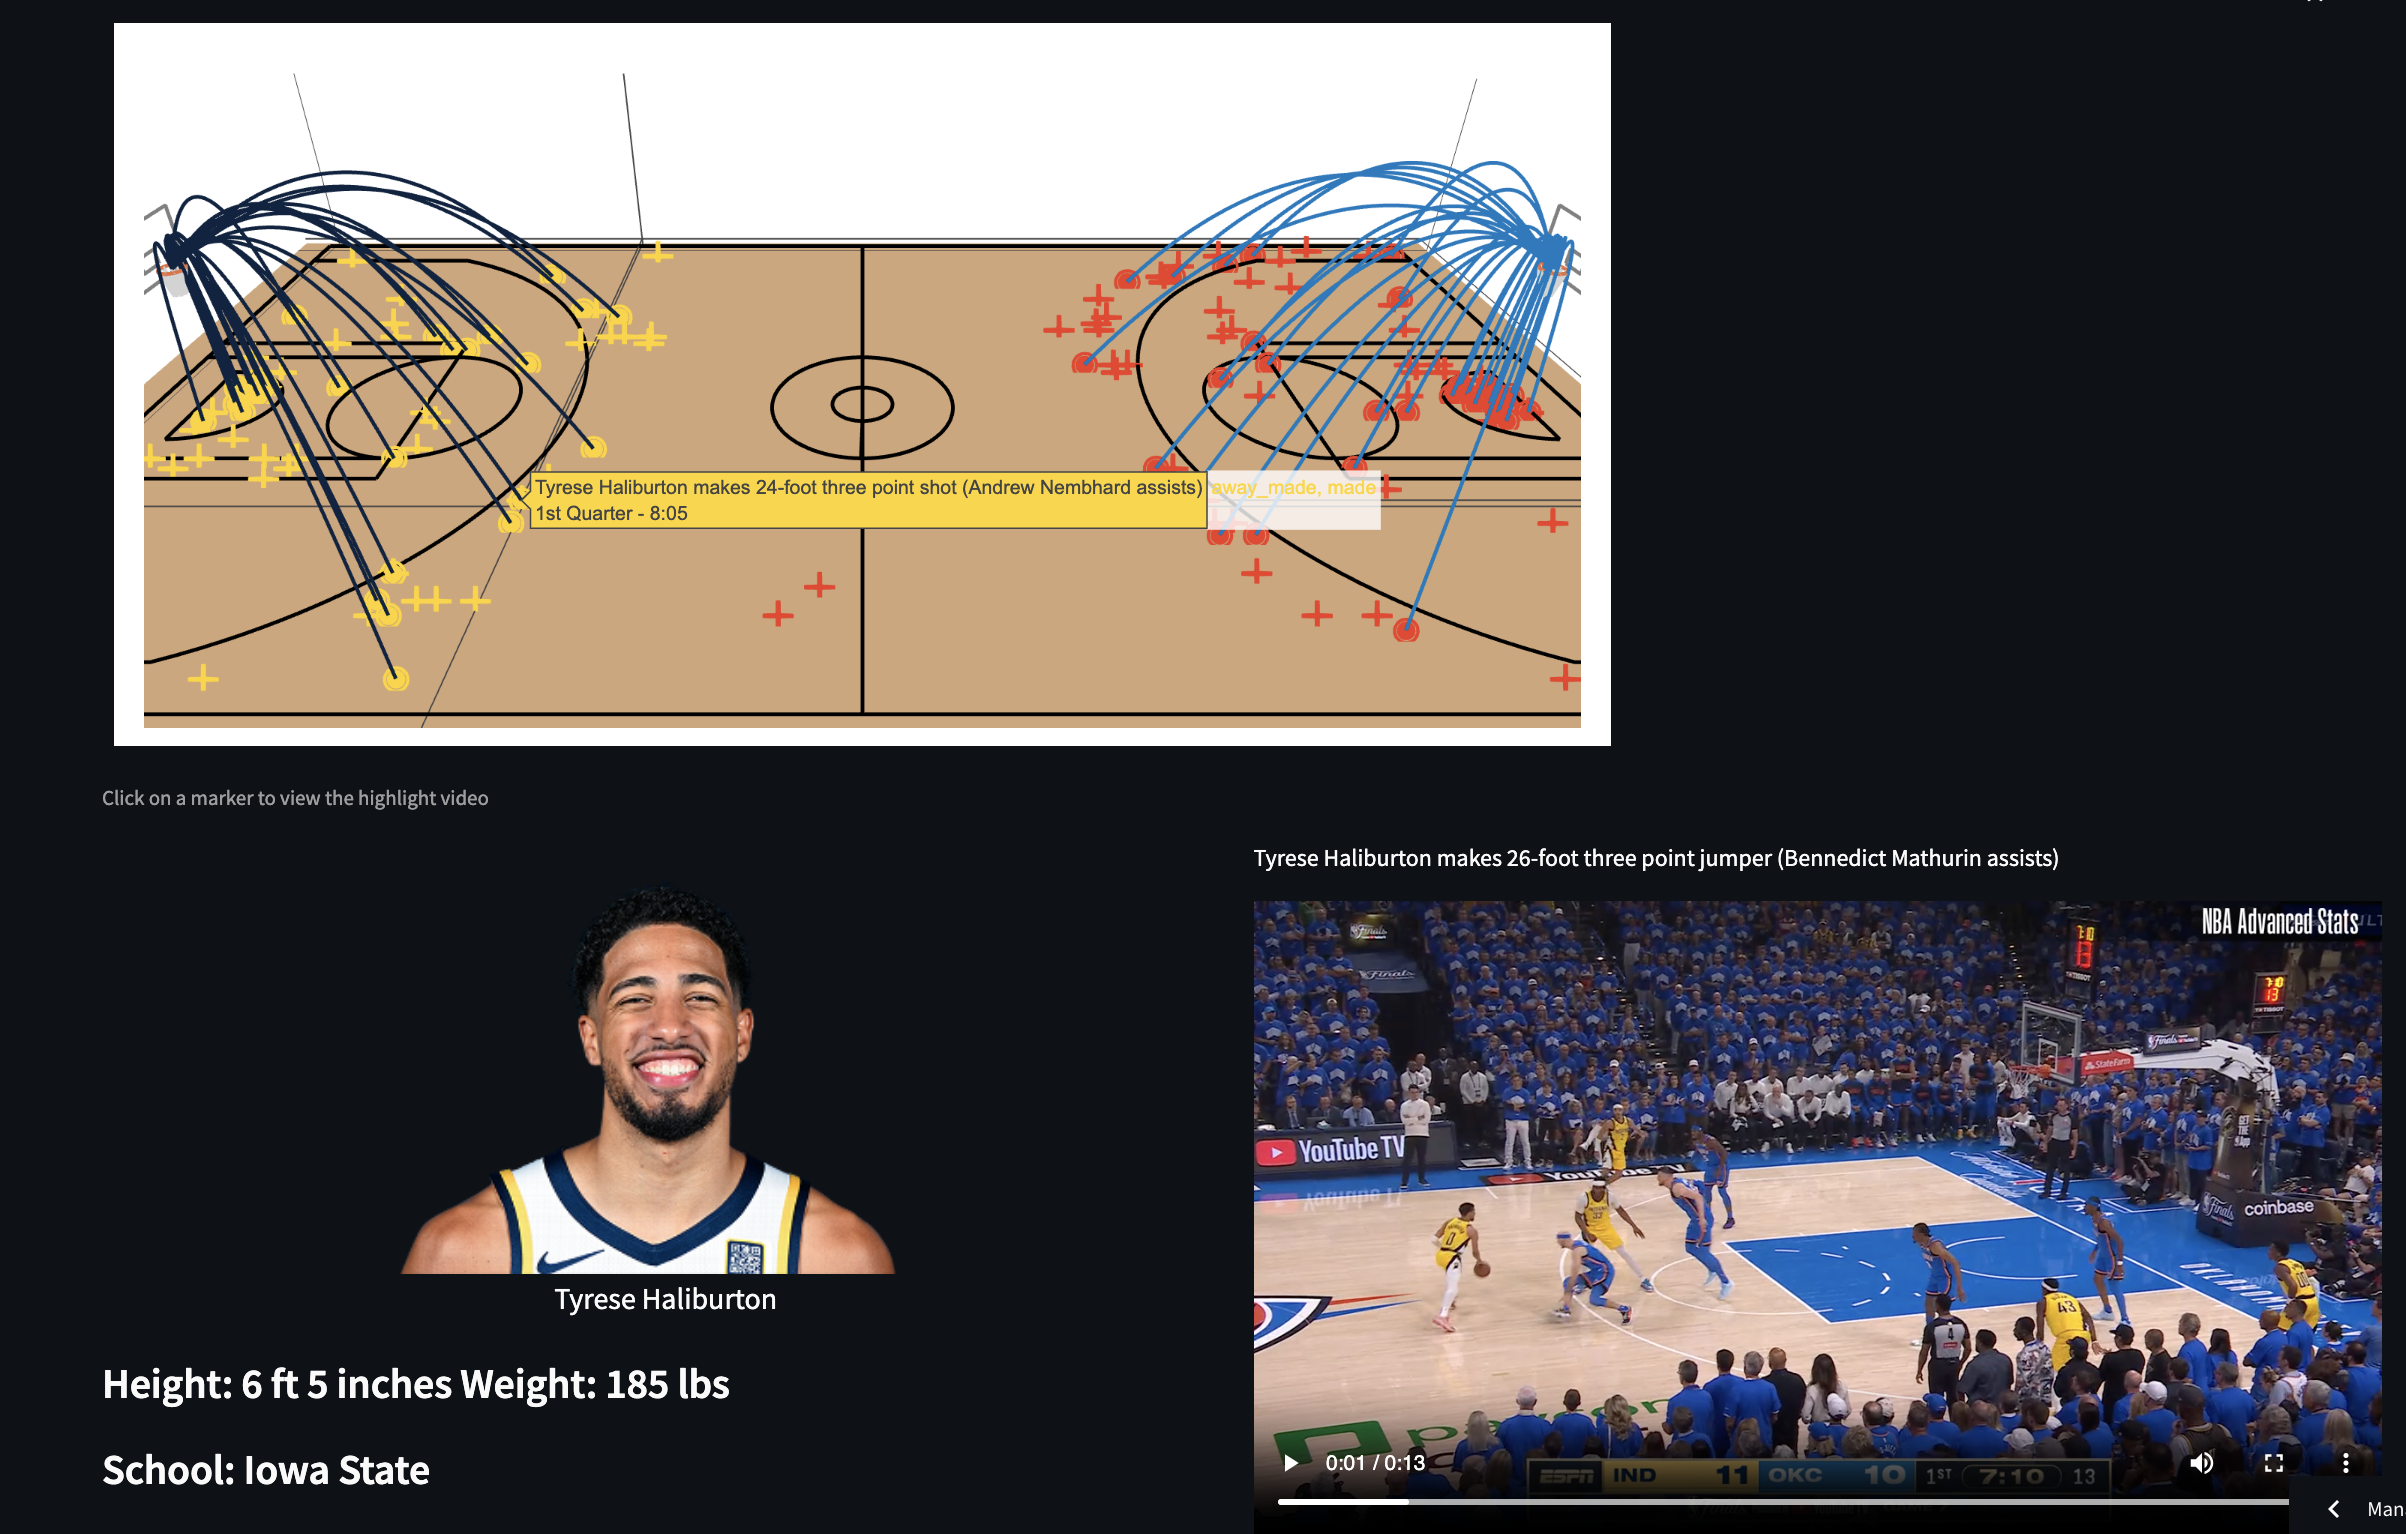
Code3D Basketball Visualizer

Plots EuroLeague, college basketball, NBA, and WNBA game shot charts with shot paths on a 3D court. Uses sportsdataverse and euroleague APIs.
Code